Dienstag, 30. Dezember 2008
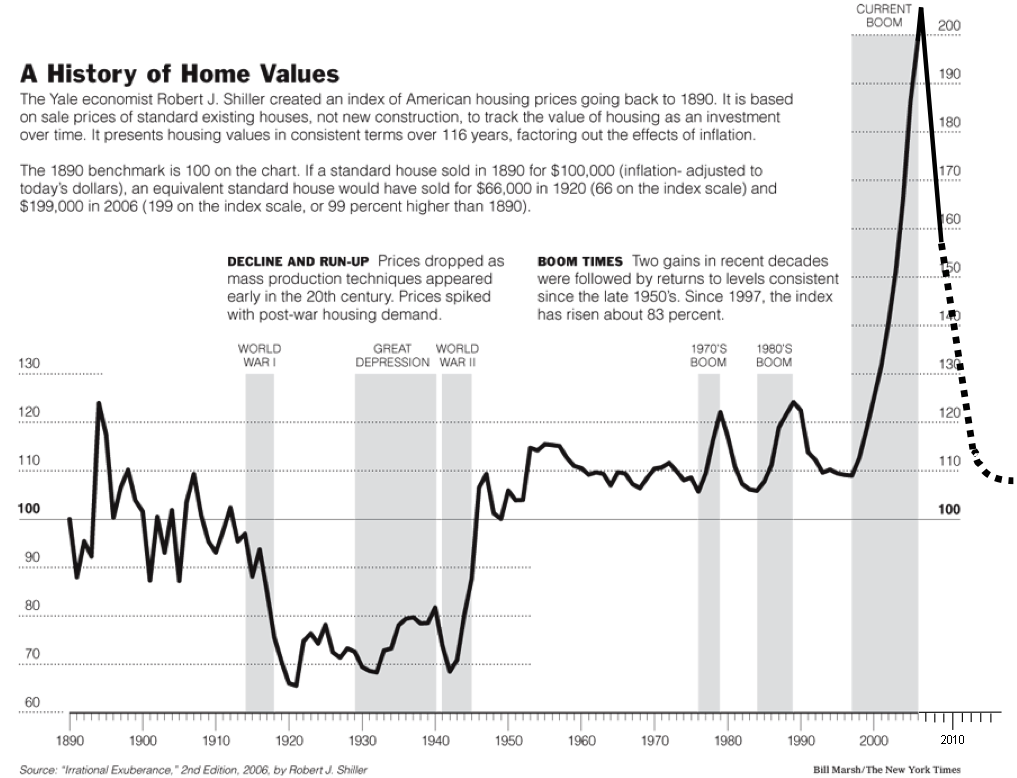
The US housing bubble in historical perspective
Blogger Barry Ritzholtz at The Big Picture presents a diagram with the long-term evolution of US housing prices according to the Case-Shiller index. The diagram shows the extreme overvaluation during the housing bubble that began in the late 90s and burst in 2007. The diagram also suggests that a further massive downward correction is unavoidable during the coming years.
Abonnieren
Kommentare zum Post (Atom)


Keine Kommentare:
Kommentar veröffentlichen